Visualizing Android Code Coverage Pt.2
@datalocaltmpIn part one of this series I described how to visualize Android application code using Dragon Dance + Frida + Lighthouse + Ghidra. Though there is one big hang-up, what if you don’t have root or want to examine a non-app process.
Fear not! For those of us who want to brave the world of non-app processes or are condemned to the lowly shell user, there is another solution explained within.
TL;DR: New tool here to generate code coverage for Android executables on non-rooted devices, description below.

This write-up will show an example of writing a native harness for the Meta Quest 2’s native library libosutils.so, it generally crashing**, and how I went about generating debugging coverage using the Frida Gadget shared library rather than Frida Server (which was required as the Quest 2 was not rooted).
Quest 2 Native Library Example
For those unaware, the Quest 2 VR headset is developed on top of Android. What’s nice about this is that you can enable developer-mode and use all the wonderful tools you’re used to as an Android developer/researcher.
I had done just that and decided to dive into the native libraries in /system/lib64/. It didn’t take much more than a quick strings ./* | grep _Z | c++filt -n to identify libosutils.so as a native library worth poking.
I got to work writing a native harness as a toy example that would take an integer representing a pid and output the associated process name, sample code below.
#include <stdlib.h>
#include <stdio.h>
#include <dlfcn.h>
#include <string.h>

int main(int argc, char *argv[]) {
    void *handle;
    char* (*getProcessName)(int, bool);

    // get a handle to the library that contains 'getProcessName' function
    handle = dlopen("libosutils.so", RTLD_LAZY);

    // reference to the dynamically-resolved function 'getProcessName'
    getProcessName = dlsym(handle, "_ZN3OVR2OS7Process14getProcessNameEib");

    char* output = getProcessName(atoi(argv[argc-1]),1);

    // cleanup
    dlclose(handle);
}
And upon running it, sure enough it crashed in the getProcessName function, coverage guided debugging time.

Coverage Guidance Gadgets
Since I did not have the ability to run Frida server as shell user, I got inventive and modified the Lighthouse Frida coverage generator to work with the Frida gadget shared library. As per the documentation for Lighthouse’s frida-drcov.py tool it should “only be used for collecting coverage data on mobile applications” and not appropriate for the native executable we’re interested in.
I separated the Python script from part one into two distinct pieces. The first piece generated raw output from Frida’s stalker code tracing engine (more here), and the second piece took this raw output and converted it into a Lighthouse compatible log.
Frida Server Gadget Method
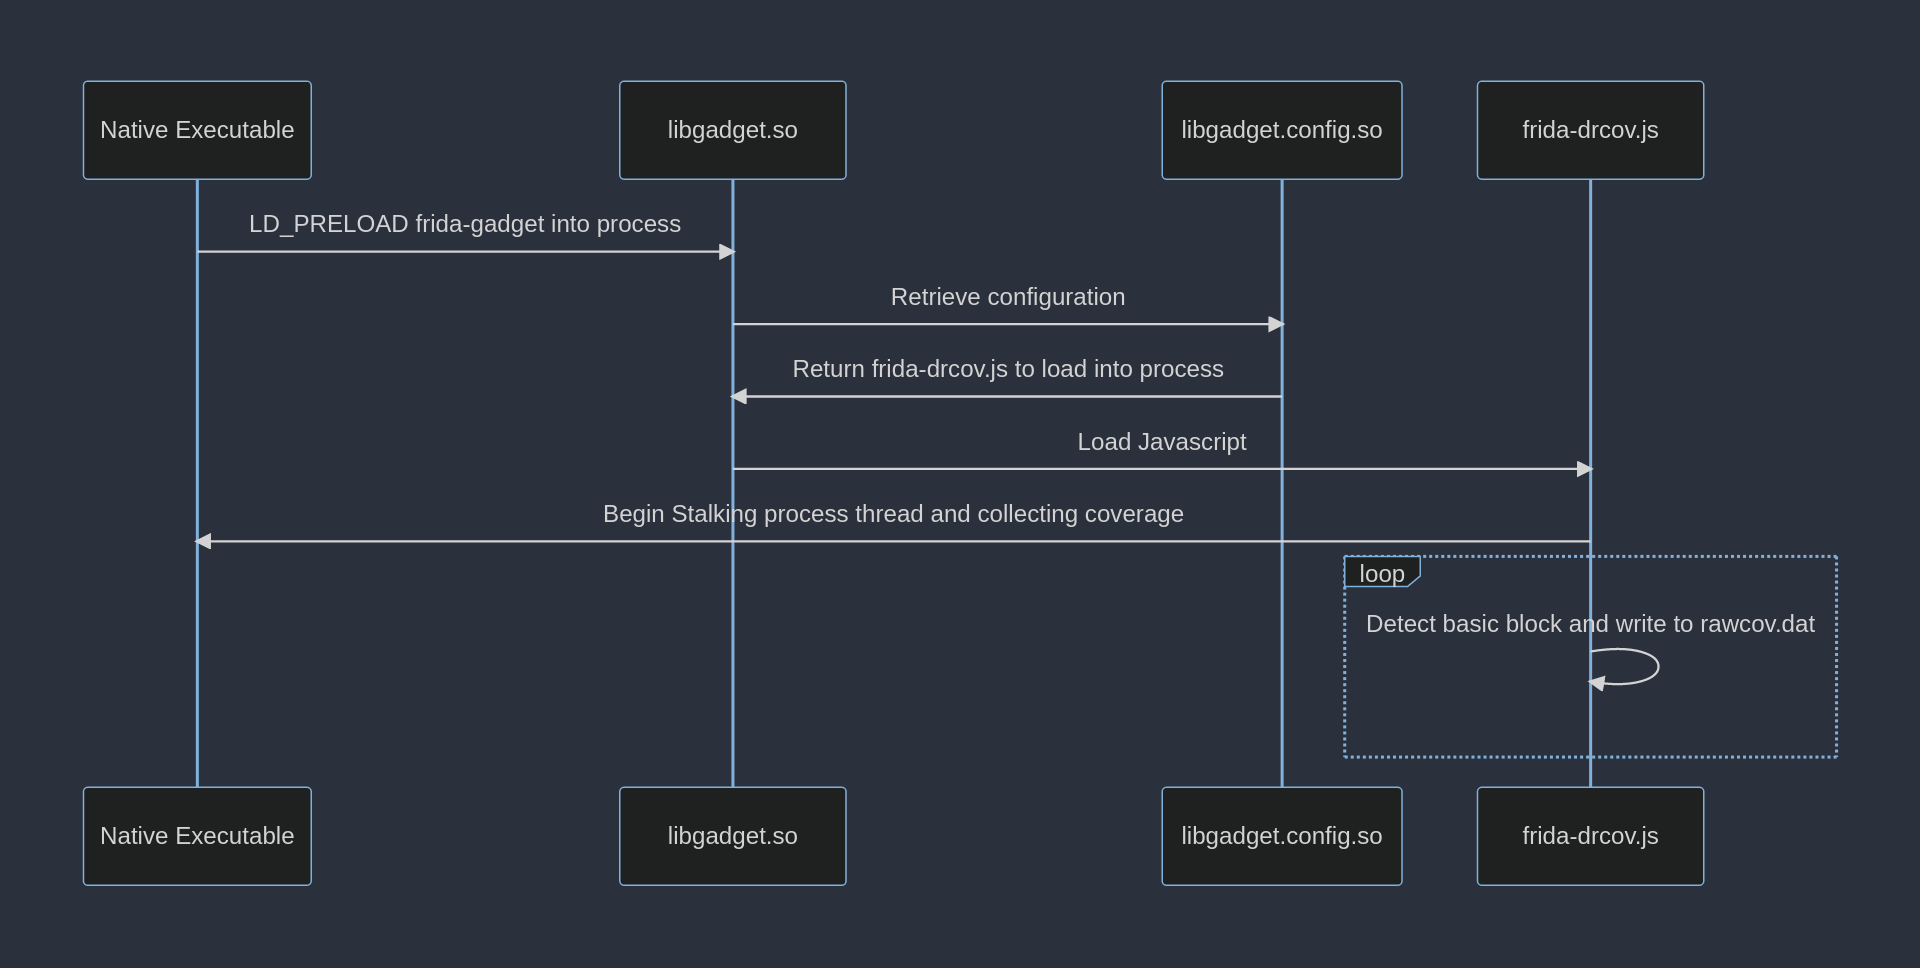
1) Rather than using frida-server, use frida gadget via LD_PRELOAD=./libgadget.so
2) Within libgadget.config.so reference the lighthouse modified javascript frida-drcov.js
3) frida-drcov.js stores raw coverage data in /data/local/tmp/rawcov.dat
4) Use modified frida-drcov.py to convert raw data to DragonDance coverage map
5) Import coverage map into Ghidra!
The code that I produced is available here, as well as libosutils.so and a sample coverage file if you’d like to follow along.
The general sequence of creating the raw coverage output is documented in the diagram below.

Et voila!
Using this new method I was able to generate the coverage map of the executed basic blocks within libosutils.so. I would be lying to say I completely figured out what was causing the crash (I suspect permissions ¯\_(ツ)_/¯); this was a toy example that was meant for illustrative purposes #CopOut.
If you have any questions feel free to send them my way @datalocaltmp, thanks for reading!
Notes
* Passing arguments to an executable which is being injected by frida-server had posed some issues for myself as it did not expect an app process to receive any arguments.
** Note that this crashing is user error and not any fault of Meta’s ;)